Showing posts with label Nikki. Show all posts

Thursday, June 5, 2008

Thursday, June 05, 2008

To start off the class, Mr max promised he'd have the stat tests back.
We are on our fourth day of reviewing for the exam , and today we've chose to review STATS.


Statistics Exam Reviw


The general learning outcomes are

  • Find the population standard deviation of a data set using tech.
  • Use z-scores to solve problems

Some Tips and Tricks.


  • Can you find the mean and standard deviation of :
    A. Ungrouped Data?
    - single data set
    -**stat- calc- 1 var stats L1

    B .Grouped Data?
    - 2 data sets (one set of boundaries and one set of frequencies)
    - **stat calc 1-Var stats L1, L2
    - boundaries * first list
    - frequencies * second list


  • Z-scores (& Normal Distributions)
    *** 68%-95%-99.7%
    z= (the mark - mean )/ standard deviation

    A. normal cdf ( lowest score, highest score, mean, standard dev.)
    OR
    normal cdf (lowest zscore, highest z score)


    B.
    www.Ronblond.com
    *Record what your inputs are.. forgetting to write your inputs WILL GET YOU NO POINTS.

    C. "Stats spreadsheet" on the network
    * This sheet will do any kind of question that will get thrown at you on the exam. ALso, record your inputs, screen shots aren't a bad idea either.

  • Binomial distributions/ conifidence intervals

    A. mean = n*p
    standard dev. = n*p*q ------> provided the distribution is binomial
    (( p is "probablity" of success
    q= "probability of failure"
    n= number of items in a data set.))

    B. Binompdf or Binomcdf*** unlikely to see on exam.
    ( # of prob trials, prob of success, no. of successes)
    pdf = implies... ""Exactly this many successes""
    cdf = imples... ""At most this many successes""
    So, P(AT LEAST) = 1- P(at most)

    C.Confidence Intervals
    To receive full marks... your answer should look like this:
    - 1propZInt
    x: __
    n: __
    C-level: ___

    *Calculator default for the interval is decimals/ percentages
    - must be converted if required
    ( p-low * n , p-high * n )

    **** As level of confidence increases size of interval Also increases.
Well guys, our exam is coming up on Wednesday & Thursday!
Study hard, it'll be worth it =)!


Tuesday, April 8, 2008

Tuesday, April 08

Hey..

Today, Ms.Tompson is our substitute. No mental math or anything done today, mainly just working on the following options. Mr max left us 2 options:

1.FINISH ALL Pathways Problems from the handout we got yesterday.

SPECIFICALLY: 3,20,29,30,33,35,40.
(doing the other questions, or at least trying them.. would help you out too!)

2. Use online course (Link is on the blog) to learn what is meant by

FUNDAMENTAL COUNTING PRINCIPLE.
oh... by the way,
be prepared to show approx 1/2 page to 1 page worth of notes and examples.

------

I found a really easy problem off the internet..
just to put something extra on my post today.

Suppose a regular die is rolled. What is the probability of getting a 3 or a 6? There are a total of 6 possible outcomes. Rolling a 3 or a 6 are two of them, so the probability is the ratio of 2/6 = 1/3.

- - Have a good rest of the day!!!

Friday, February 29, 2008

Friday, February 29

hey,

Today is Friday, Mr max is gone and Mr Riche is our sub. I wasn't here yesterday for what he taught us but I asked a few people in class and he gave us an assignment. The assignment is still the same as you guys got yesterday, and is STILL due for Monday!

Just for a reminder :

Exercise #2; 3-10
* learn what a resultant is..

AND...

Exercise #3; 3,4,5,6


Use the website Mr max provided us with and I'm sure it'll help!!


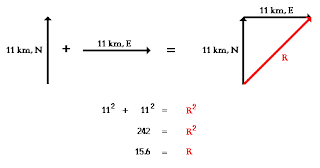
Here is a picture of some simple vector addition.
It's just simply the pythagorean theory, square the first arrow, by the
second arrow, then there is your answer that you square to get the Resultant.

Here is a cool pic that shows how to calculate a Resultant.